













Panchthar Power Company Limited – First Quarter Analysis, FY 2083/84
Unaudited results as on Ashwin end 2083, compared with the same quarter last year (Ashwin end 2082) and with Ashad end 2083.
Summary
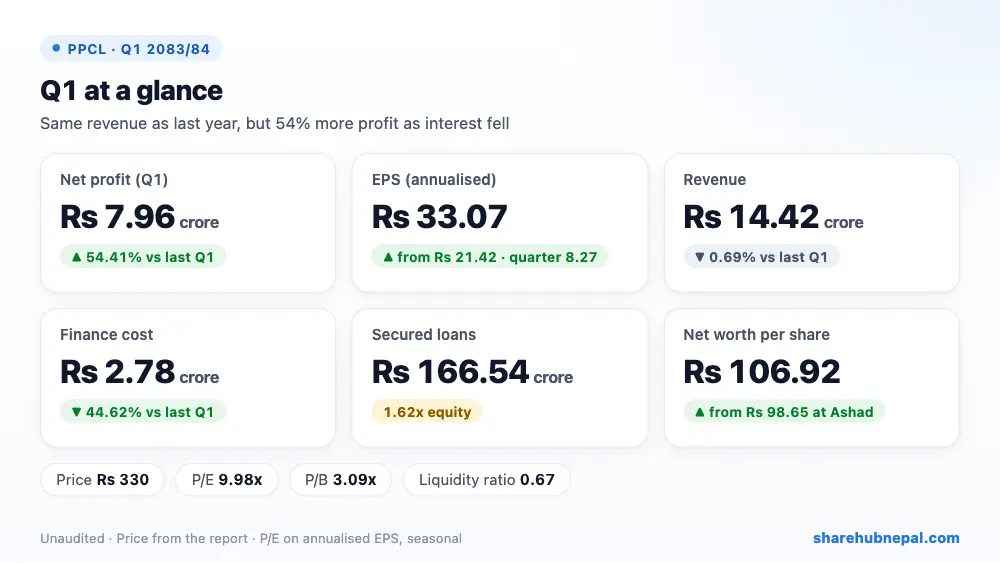
Panchthar Power earned a net profit of Rs 7.96 crore in the first quarter, up 54.41% from Rs 5.15 crore a year ago. Quarter EPS is Rs 8.27 (Rs 33.07 annualised).
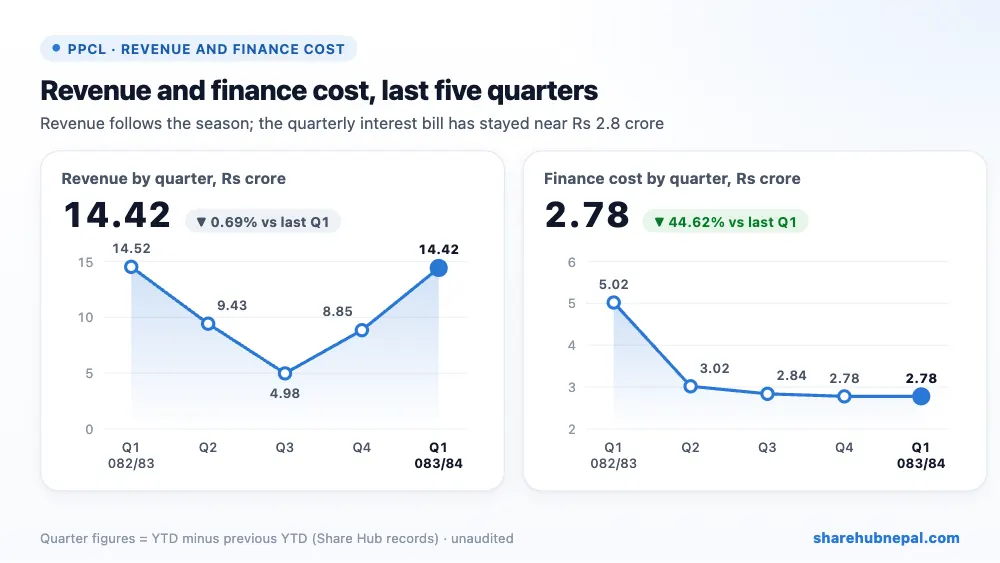
Revenue was almost the same as last year at Rs 14.42 crore (−0.69%), so the higher profit came from lower costs: finance cost fell 44.62% to Rs 2.78 crore, direct expenses fell to Rs 28.15 lakh from Rs 1.00 crore and depreciation fell 21.40%. Other operating costs rose to Rs 82.00 lakh from Rs 15.34 lakh. The project was hit by floods in Ashad 2080 and again on 12 Ashwin 2081; after repairs, generation restarted on 16 Chaitra 2081 and has been regular since. No income tax is charged.
| Indicator | Q1 2083/84 | Q1 2082/83 | Change |
| Revenue from operations | Rs 144,235,150 | Rs 145,239,760 | −0.69% |
| Direct expenses | Rs 2,814,590 | Rs 10,002,980 | −71.86% |
| Staff and other operating costs | Rs 11,224,380 | Rs 4,445,870 | +152.47% |
| Finance cost | Rs 27,781,660 | Rs 50,162,240 | −44.62% |
| Depreciation | Rs 22,866,510 | Rs 29,093,470 | −21.40% |
| Net profit | Rs 79,578,100 | Rs 51,535,760 | +54.41% |
| EPS (annualised) | 33.07 | 21.42 | – |
1. Where the profit came from
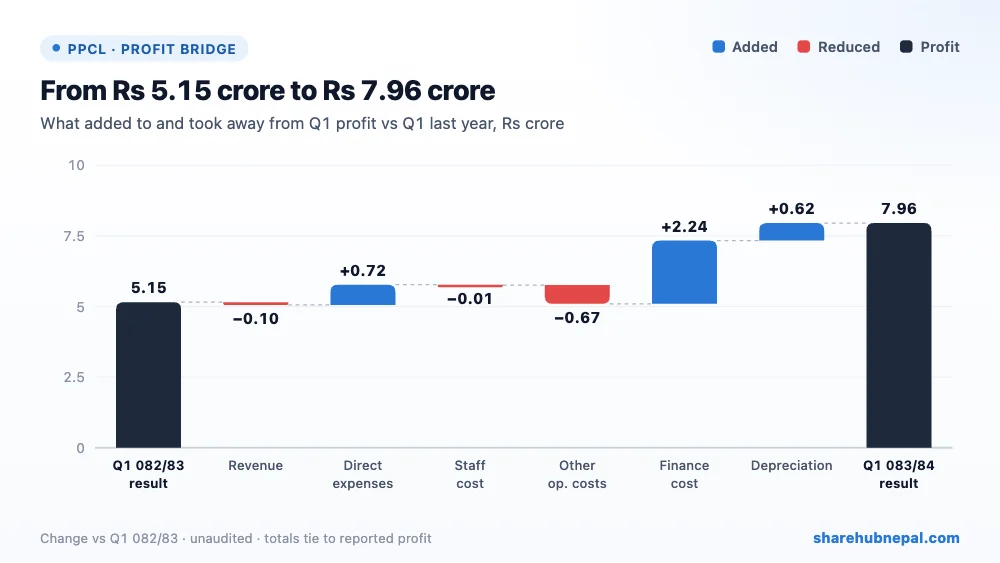
Compared with last year's Q1, lower finance cost added Rs 2.24 crore, lower direct expenses Rs 71.88 lakh and lower depreciation Rs 62.27 lakh. Higher other operating costs took away Rs 66.66 lakh, slightly lower revenue Rs 10.05 lakh and higher staff cost Rs 1.13 lakh.
2. Profit through the year
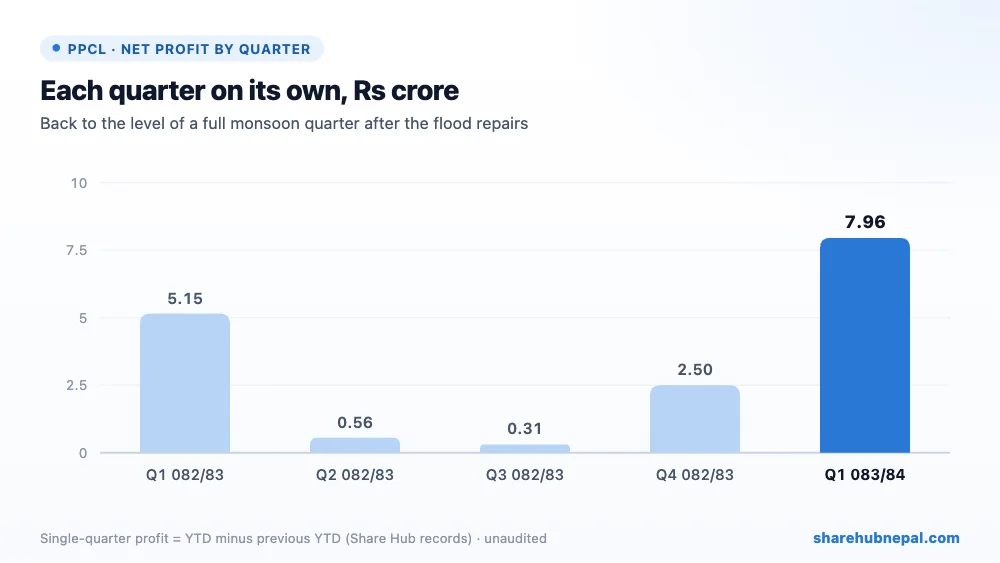
Based on Share Hub's records, single-quarter profit in 2082/83 was Rs 5.15 crore in Q1, Rs 55.90 lakh in Q2, Rs 30.68 lakh in Q3 and Rs 2.50 crore in Q4; the audited full-year profit was Rs 8.52 crore (EPS 8.85). This Q1 alone is 93% of last year's full-year profit, which shows how seasonal the business is.
3. Debt and balance sheet
| Particulars | Ashwin 2083 | Ashad 2083 | Change |
| Secured and unsecured loans | Rs 1,665,371,080 | Rs 1,706,613,630 | −2.42% |
| Property, plant and equipment | Rs 2,766,143,710 | Rs 2,787,560,220 | −0.77% |
| Sundry debtors | Rs 100,735,740 | Rs 73,581,440 | +36.90% |
| Cash and bank balance | Rs 34,873,940 | Rs 1,406,010 | +2380.35% |
| Trade and other payables | Rs 218,363,590 | Rs 221,627,540 | −1.47% |
| Total assets | Rs 2,912,820,820 | Rs 2,877,749,220 | +1.22% |
| Total equity | Rs 1,029,086,150 | Rs 949,508,050 | +8.38% |
Loans fell to Rs 166.54 crore from Rs 170.66 crore at Ashad end (the small unsecured loan was repaid), 1.62 times equity. Cash rose to Rs 3.49 crore and amounts due from NEA (sundry debtors) to Rs 10.07 crore. Current liabilities of Rs 21.84 crore are larger than current assets of Rs 14.67 crore (liquidity ratio 0.67), which is tight. Equity grew by the quarter's profit to Rs 102.91 crore, and net worth per share moved back above face value to Rs 106.92.
4. Per-share figures and valuation
| Indicator | Value |
| EPS (quarter, as reported) | Rs 8.27 |
| EPS (annualised) | Rs 33.07 |
| Net worth per share | Rs 106.92 |
| Total assets per share | Rs 302.63 |
| Market price (report) | Rs 330.00 |
| P/E (annualised EPS) | 9.98x |
| P/B | 3.09x |
| Liquidity ratio | 0.67 |
At Rs 330 the share trades at 9.98 times annualised EPS and 3.09 times net worth per share. Because Q1 is the peak season, full-year EPS will be much lower than Rs 33.07; on last year's EPS of Rs 8.85 the P/E is about 37.3.
Conclusion
Positives: profit up 54.41%, finance cost down 44.62%, regular generation after the flood repairs, loans being repaid, and net worth back above face value.
Watch: flat revenue, other operating costs up more than five times, a tight liquidity ratio (0.67), debt at 1.62x equity, flood risk on the river, and a seasonal Q1 that overstates the annual EPS.
Panchthar Power had a good monsoon quarter mainly because interest and other costs fell. The dry-season quarters and continued loan repayment will decide whether the full year beats last year's Rs 8.52 crore.
Figures are from the company's unaudited Q1 report; quarter trends use Share Hub records. This is not investment advice.

