













Super Madi Hydropower Limited – First Quarter Analysis, FY 2083/84
Unaudited results as on Ashwin end 2083, compared with the same quarter last year (Ashwin end 2082) and with Ashad end 2083.
Summary
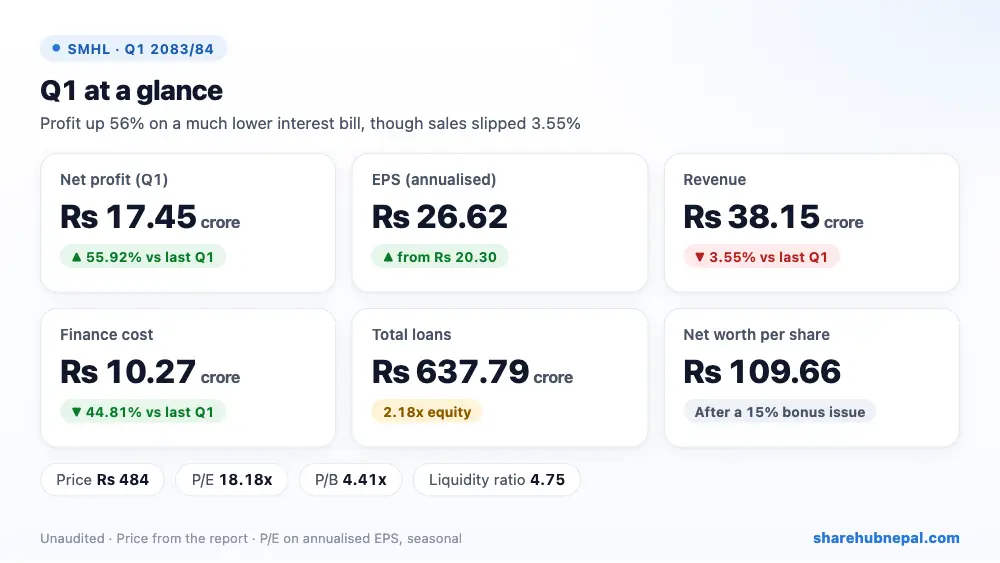
Super Madi Hydropower earned a net profit of Rs 17.45 crore in the first quarter, up 55.92% from Rs 11.19 crore a year ago. Annualised EPS is Rs 26.62 as reported (Rs 6.55 for the quarter on the shares after the 15% bonus issue).
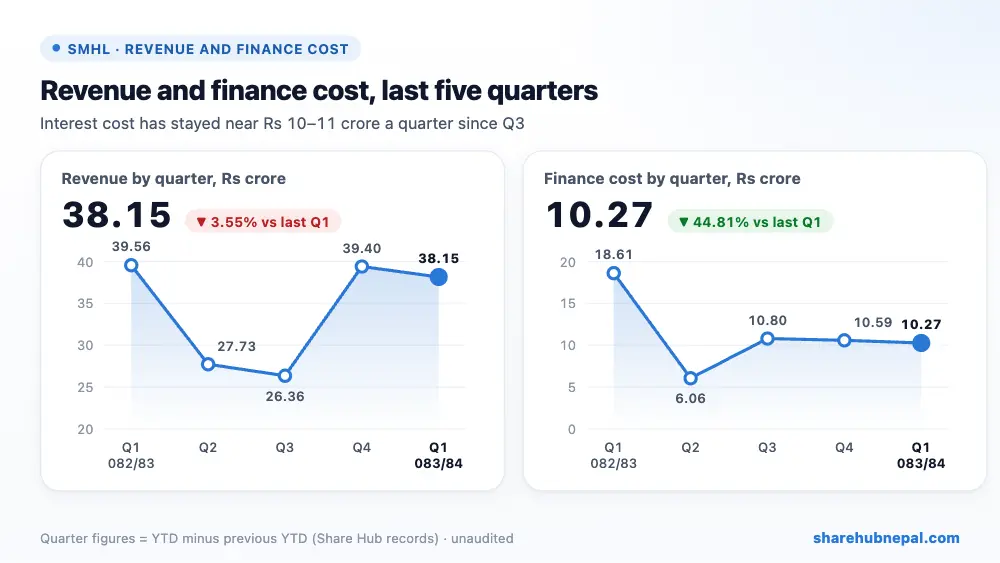
Revenue slipped 3.55% to Rs 38.15 crore; the company says NEA's load-dispatch instructions at times keep the plant from running at full capacity. The jump in profit came from interest: finance cost fell 44.81% to Rs 10.27 crore. Other operating costs rose to Rs 1.91 crore, but direct expenses were lower and there was no separate staff cost. The net profit margin rose to 45.73% from 28.28%. No income tax is charged.
| Indicator | Q1 2083/84 | Q1 2082/83 | Change |
| Revenue from operations | Rs 381,503,260 | Rs 395,563,140 | −3.55% |
| Direct expenses | Rs 7,512,960 | Rs 10,469,060 | −28.24% |
| Staff and other operating costs | Rs 19,118,900 | Rs 8,273,520 | +131.09% |
| Finance cost | Rs 102,678,460 | Rs 186,050,450 | −44.81% |
| Depreciation | Rs 77,740,460 | Rs 78,885,820 | −1.45% |
| Net profit | Rs 174,452,480 | Rs 111,884,280 | +55.92% |
| EPS (annualised) | 26.62 | 20.30 | – |
1. Where the profit came from
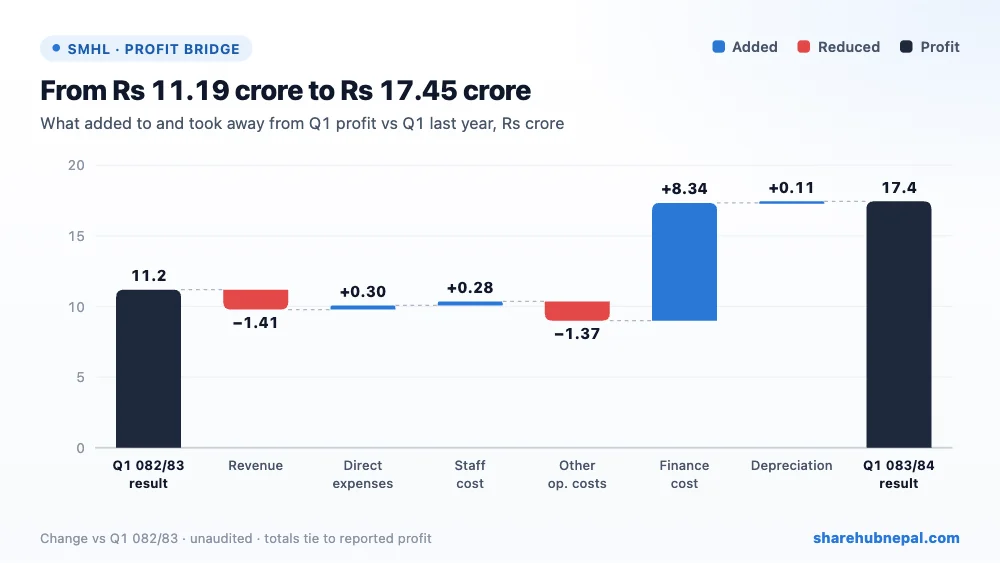
Compared with last year's Q1, lower finance cost added Rs 8.34 crore, and lower direct and staff costs about Rs 57.84 lakh together. Higher other operating costs took away Rs 1.37 crore and lower revenue Rs 1.41 crore.
2. Profit through the year
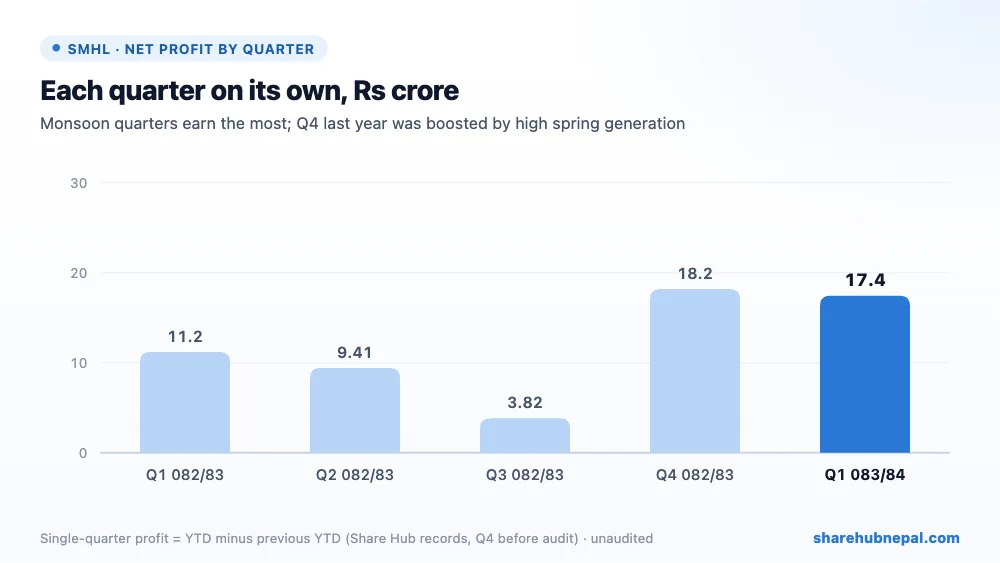
Based on Share Hub's records, single-quarter profit in 2082/83 was Rs 11.19 crore in Q1, Rs 9.41 crore in Q2, Rs 3.82 crore in Q3 and Rs 18.18 crore in Q4. The audit later revised the full-year profit to Rs 42.28 crore (Share Hub's Q4 record still shows Rs 42.60 crore). This Q1 is close to last year's best quarter.
3. Debt and balance sheet
| Particulars | Ashwin 2083 | Ashad 2083 | Change |
| Secured and unsecured loans | Rs 6,377,859,000 | Rs 6,617,383,260 | −3.62% |
| Property, plant and equipment | Rs 7,923,467,840 | Rs 8,001,208,310 | −0.97% |
| Investments | Rs 943,316,500 | Rs 943,316,500 | +0.00% |
| Other loans and advances | Rs 497,560,100 | Rs 584,533,440 | −14.88% |
| Cash and bank balance | Rs 45,435,340 | Rs 7,245,970 | +527.04% |
| Total assets | Rs 9,412,357,460 | Rs 9,541,365,890 | −1.35% |
| Total equity | Rs 2,919,632,020 | Rs 2,763,457,830 | +5.65% |
Total loans fell to Rs 637.79 crore (Rs 537.79 crore secured plus Rs 100 crore unsecured) from Rs 661.74 crore at Ashad end, still 2.18 times equity. The company issued 15% bonus shares, taking paid-up capital to Rs 266.25 crore, so net worth per share fell to Rs 109.66 from Rs 119.36. Equity rose Rs 15.62 crore, about Rs 1.83 crore less than the quarter's profit (the report does not say why; probably the cash part of the dividend). Cash rose to Rs 4.54 crore, and the liquidity ratio is 4.75.
4. Per-share figures and valuation
| Indicator | Value |
| EPS (annualised, as reported) | Rs 26.62 |
| EPS (quarter, current shares) | Rs 6.55 |
| Net worth per share | Rs 109.66 |
| Total assets per share | Rs 353.51 |
| Market price (report) | Rs 484.00 |
| P/E (annualised EPS) | 18.18x |
| P/B | 4.41x |
| Liquidity ratio | 4.75 |
At Rs 484 the share trades at 18.18 times annualised EPS and 4.41 times net worth per share. Because the monsoon quarter is among the strongest, the full-year EPS is likely to be below Rs 26.62.
Conclusion
Positives: profit up 55.92%, finance cost down 44.81%, loans being repaid (Rs 23.95 crore in the quarter), a 15% bonus issue, and strong liquidity.
Watch: revenue down 3.55% with NEA dispatch limits, debt still 2.18x equity, other operating costs more than three times last year, a P/B of 4.41x, and a seasonal Q1 that overstates the annual EPS.
Super Madi's profit is rising mainly because its large loan is being paid down. Steady dispatch from NEA and continued debt reduction are the keys for the rest of the year.
Figures are from the company's unaudited Q1 report; quarter trends use Share Hub records. This is not investment advice.

