













Trade Tower Limited – First Quarter Analysis, FY 2083/84
Unaudited results as on Ashwin end 2083, compared with the same quarter last year (Ashwin end 2082) and with Ashad end 2083.
Summary
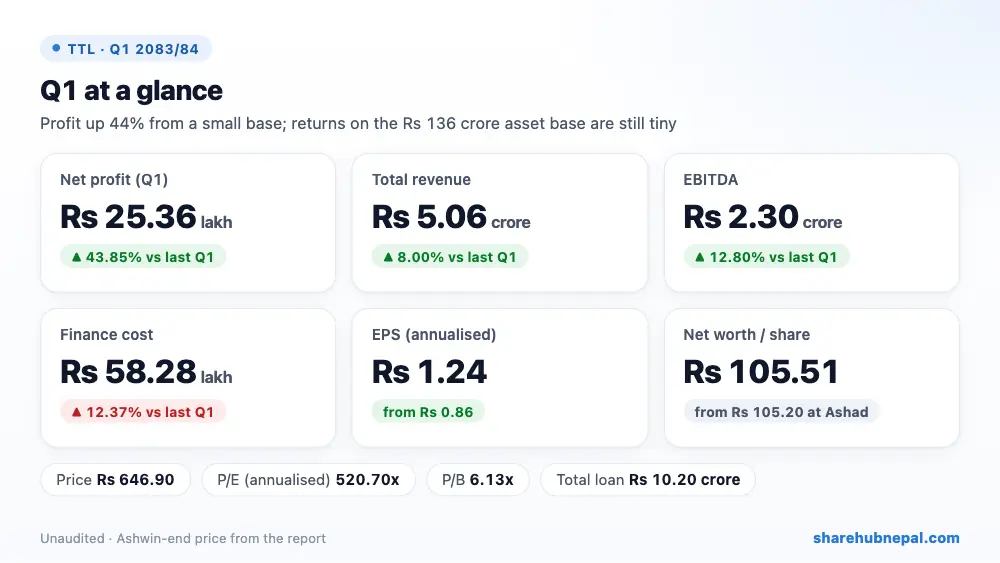
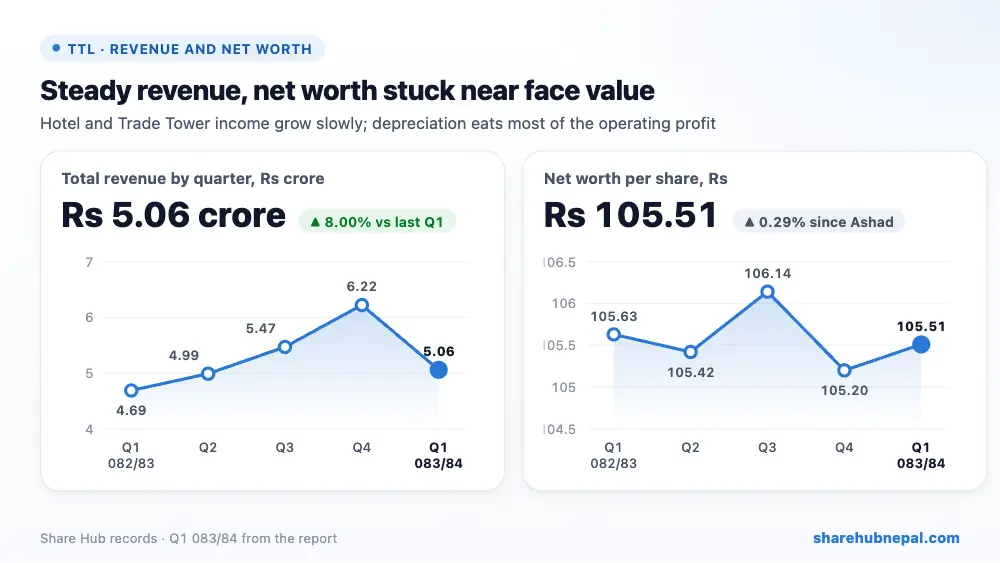
Trade Tower, which runs a hotel and the Trade Tower business centre in Thapathali, earned Rs 25.36 lakh in the first quarter, up 43.85% from Rs 17.63 lakh. Hotel revenue rose 8.01% to Rs 2.22 crore and Trade Tower (TTN) income 7.98% to Rs 2.84 crore. Employee and admin costs fell, but cost of operation rose 33.19%. Depreciation (Rs 1.43 crore) and interest (Rs 58.28 lakh) take most of the operating profit, so the bottom line stays small. Annualised EPS is Rs 1.24.
| Indicator | Q1 2083/84 | Q1 2082/83 | Change |
| Revenue from sales | Rs 50,638,251 | Rs 46,889,191 | +8.00% |
| Cost of sales | Rs 7,913,814 | Rs 5,941,680 | +33.19% |
| Other income | Rs 0 | Rs 0 | – |
| Operating profit | Rs 22,957,356 | Rs 20,352,047 | +12.80% |
| Finance cost | Rs 5,828,350 | Rs 5,186,702 | +12.37% |
| Income tax | Rs 0 | Rs 0 | – |
| Net profit | Rs 2,536,127 | Rs 1,763,074 | +43.85% |
| EPS (annualised) | 1.24 | 0.86 | – |
| Net worth per share | 105.51 | 105.75 | – |
1. Where the profit came from
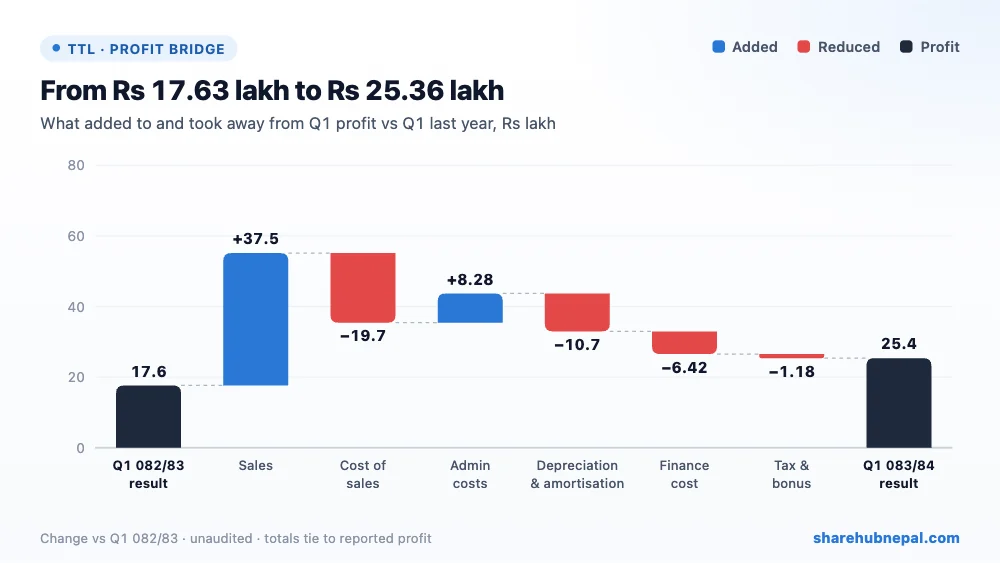
Higher revenue added Rs 37.49 lakh and lower staff and admin costs Rs 8.28 lakh. Higher cost of operation took away Rs 19.72 lakh, depreciation Rs 10.73 lakh and interest Rs 6.42 lakh. No income tax was charged this quarter.
2. Profit through the year
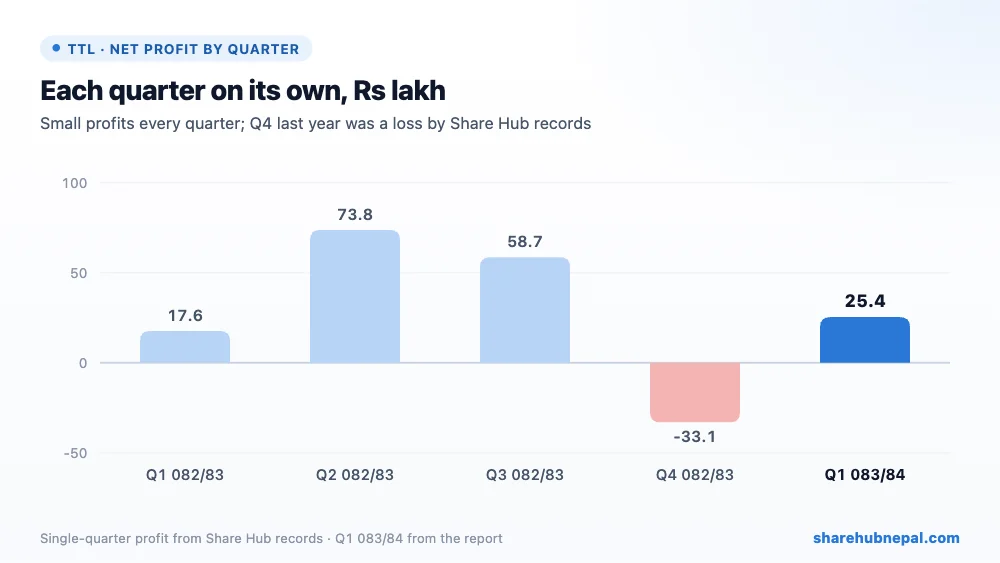
Profit by quarter (Share Hub records): Q1 082/83: Rs 17.63 lakh, Q2 082/83: Rs 73.78 lakh, Q3 082/83: Rs 58.66 lakh, Q4 082/83: −Rs 33.12 lakh, Q1 083/84: Rs 25.36 lakh. Note: the report shows FY 2082/83 profit of Rs 73.83 lakh, while Share Hub's Q4 record shows Rs 1.17 crore; the gap is noted for review.
3. Debt and balance sheet
| Particulars | Ashwin 2083 | Ashad 2083 | Change |
| Total assets | Rs 1,366,109,044 | Rs 1,378,659,555 | −0.91% |
| Total equity | Rs 860,573,535 | Rs 858,037,408 | +0.30% |
| Long-term borrowings | Rs 72,589,978 | Rs 75,381,900 | −3.70% |
| Current borrowings | Rs 29,369,599 | Rs 27,741,440 | +5.87% |
| Cash and equivalents | Rs 8,240,773 | Rs 11,750,853 | −29.87% |
Debt is small: a long-term loan of Rs 7.26 crore and short-term borrowing of Rs 2.94 crore against equity of Rs 86.06 crore. But the company also carries Rs 22.37 crore of other long-term liabilities and Rs 15.68 crore of lease liabilities. Loans and advances given rose to Rs 10.74 crore while cash fell to Rs 82.41 lakh. Current ratio is 2.42.
4. Per-share figures and valuation
| Indicator | Value |
| EPS (annualised) | Rs 1.24 |
| Net worth per share | Rs 105.51 |
| Market price (Ashwin end) | Rs 646.9 |
| P/E (annualised) | 521.69x |
| P/B | 6.13x |
At the Ashwin-end price of Rs 646.9, the share trades at 521.69 times annualised EPS and 6.13 times net worth per share. That is extremely expensive: the company earns well under 1% on its equity.
Conclusion
Positives: revenue growing in both businesses, profit up 44%, low bank debt, lower staff and admin costs.
Watch: very thin profit, high depreciation, rising operating cost and interest, low cash, a P/E above 500, and a Q4 record that does not match the report.
Trade Tower is a steady but low-return property and hotel business. The share price is far ahead of what the company earns.
Figures are from the company's unaudited Q1 report; quarter trends use Share Hub records. This is not investment advice.

