













Upper Lohore Khola Hydropower Company Limited – First Quarter Analysis, FY 2083/84
Unaudited results as on Ashwin end 2083, compared with the same quarter last year (Ashwin end 2082) and with Ashad end 2083.
Summary
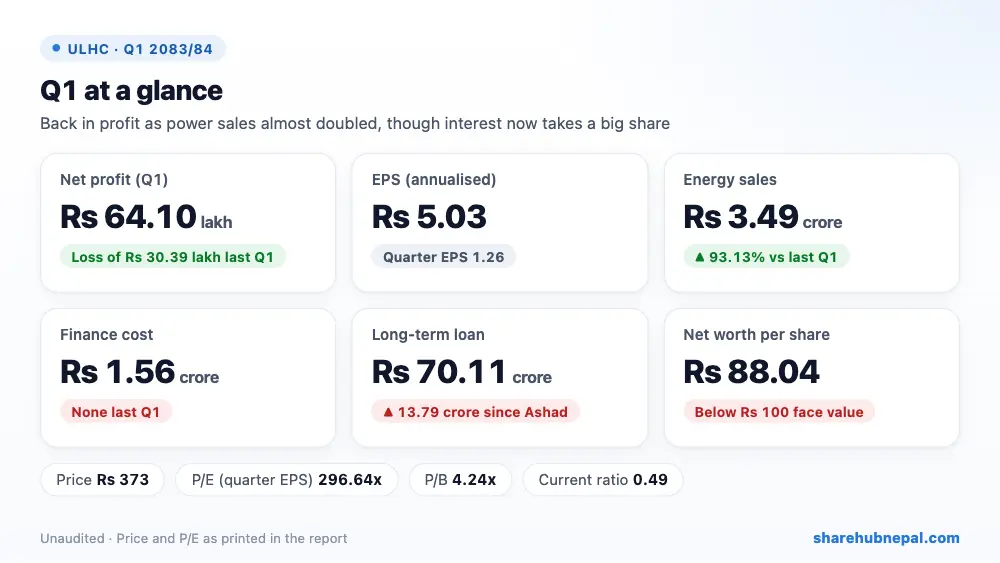
Upper Lohore Khola Hydropower, which runs the 4 MW Upper Lohore Khola project, earned a net profit of Rs 64.10 lakh in the first quarter, against a loss of Rs 30.39 lakh a year ago. Quarter EPS is Rs 1.26 (Rs 5.03 annualised).
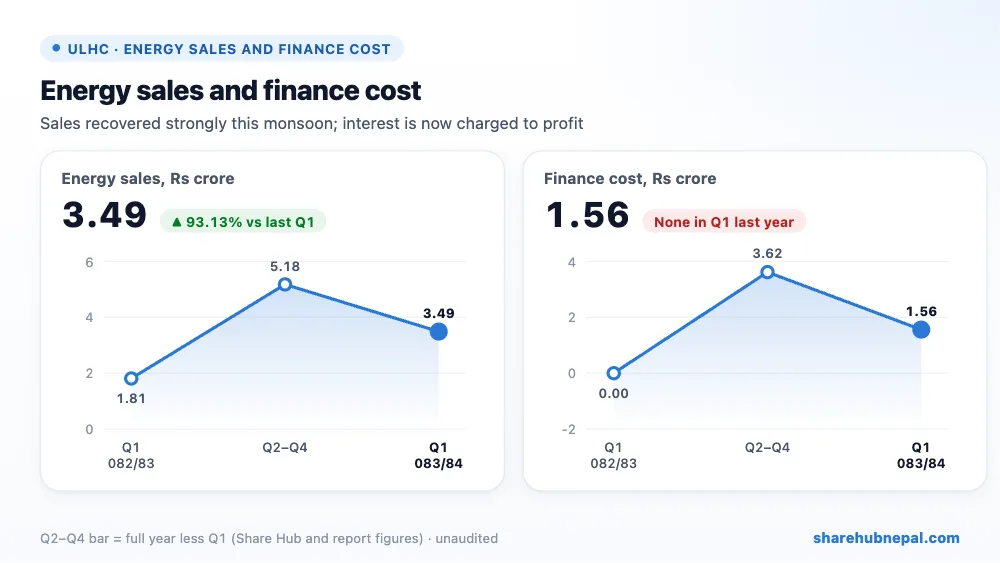
Energy sales almost doubled (+93.13%) to Rs 3.49 crore and cost of sales fell to Rs 19.28 lakh from Rs 1.03 crore, so earnings before interest and tax were Rs 2.20 crore. But finance cost of Rs 1.56 crore, which was not charged at all in Q1 last year, took most of it. The full year 2082/83 ended in a loss of Rs 2.90 crore.
| Indicator | Q1 2083/84 | Q1 2082/83 | Change |
| Revenue from sale of energy | Rs 34,868,760 | Rs 18,054,156 | +93.13% |
| Cost of sales | Rs 1,928,016 | Rs 10,267,203 | −81.22% |
| Depreciation and amortisation | Rs 10,031,058 | Rs 9,789,427 | +2.47% |
| Earnings before interest and tax | Rs 21,987,800 | −Rs 3,039,309 | Turned to profit |
| Financial expenses | Rs 15,577,541 | Rs 0 | – |
| Net profit/(loss) | Rs 6,410,259 | −Rs 3,039,309 | Turned to profit |
| EPS (quarter) | 1.26 | -0.60 | – |
1. Where the profit came from
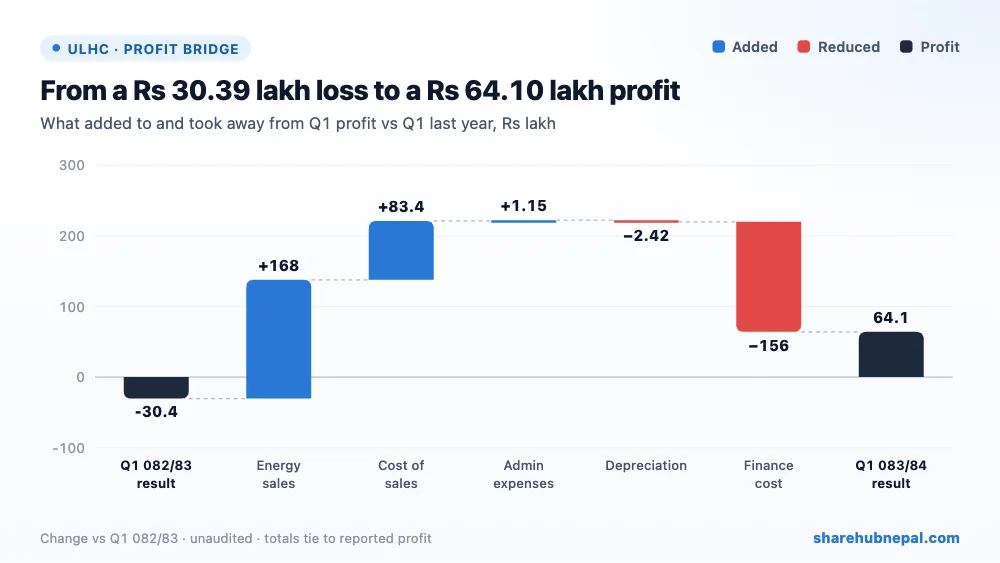
Compared with last year's Q1, higher energy sales added Rs 1.68 crore and lower cost of sales Rs 83.39 lakh, with a small saving in administrative costs (Rs 1.15 lakh). Finance cost took away Rs 1.56 crore and higher depreciation Rs 2.42 lakh.
2. Profit through the year
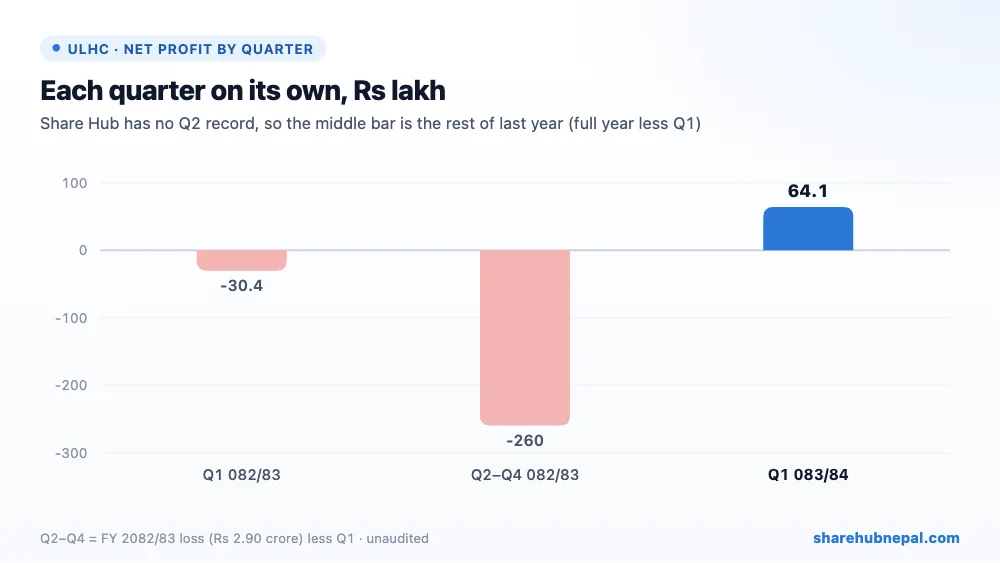
Share Hub had no record for Q1 2082/83, so one was added from this report's comparison column (loss of Rs 30.39 lakh). There is no Q2 record, so the chart shows the rest of last year as one bar: a loss of Rs 2.60 crore over Q2–Q4, for a full-year loss of Rs 2.90 crore. This Q1 profit is the first positive quarter in those figures.
3. Debt and balance sheet
| Particulars | Ashwin 2083 | Ashad 2083 | Change |
| Long-term borrowings | Rs 701,090,000 | Rs 563,169,476 | +24.49% |
| Short-term loans | Rs 5,261,303 | Rs 2,000,000 | +163.07% |
| Other financial liabilities (current) | Rs 104,792,021 | Rs 169,388,090 | −38.13% |
| Investment | Rs 60,000,000 | Rs 0 | – |
| Trade receivables | Rs 23,154,974 | Rs 3,589,998 | +544.99% |
| Cash and cash equivalents | Rs 1,473,921 | Rs 7,730,246 | −80.93% |
| Total assets | Rs 1,265,610,107 | Rs 1,189,910,003 | +6.36% |
| Total equity | Rs 448,849,431 | Rs 451,209,992 | −0.52% |
Long-term borrowings rose to Rs 70.11 crore from Rs 56.32 crore at Ashad end, while current financial liabilities fell to Rs 10.48 crore from Rs 16.94 crore, which suggests some short-term obligations were refinanced. The company also made a new Rs 6 crore investment in Everest Energy and Infrastructure. Cash is only Rs 14.74 lakh and the current ratio is 0.49, which is tight. Equity fell Rs 23.61 lakh in the quarter even though there was a profit; the report does not explain the gap of about Rs 87.71 lakh. Net worth per share is Rs 88.04, below face value.
4. Per-share figures and valuation
| Indicator | Value |
| EPS (quarter, as reported) | Rs 1.26 |
| EPS (annualised) | Rs 5.03 |
| Net worth per share | Rs 88.04 |
| Total assets per share | Rs 248.25 |
| Market price (report) | Rs 373 |
| P/E (report, quarter EPS) | 296.64x |
| P/B | 4.24x |
| Current ratio | 0.49 |
The report prints a price of Rs 373 and a P/E of 296.64 on the quarter EPS of Rs 1.26. On annualised EPS of Rs 5.03 the P/E is about 74, and the share trades at 4.24 times net worth per share, which is high for a company with accumulated losses.
Conclusion
Positives: back to profit, energy sales almost doubled, much lower cost of sales, and regular payments received from NEA.
Watch: finance cost of Rs 1.56 crore a quarter, long-term debt up Rs 13.79 crore, a current ratio of 0.49, accumulated losses, net worth below face value, an unexplained fall in equity, and a new outside investment while cash is very low.
The monsoon quarter brought Upper Lohore back to profit, but its interest bill and thin liquidity remain the main risks. The dry-season quarters will show whether it can stay profitable for the year.
Figures are from the company's unaudited Q1 report; quarter trends use Share Hub records. This is not investment advice.

