













Himalayan Power Partner Ltd – First Quarter Analysis, FY 2083/84
Unaudited results as on Ashwin end 2083, compared with the same quarter last year (Ashwin end 2082) and with Ashad end 2083.
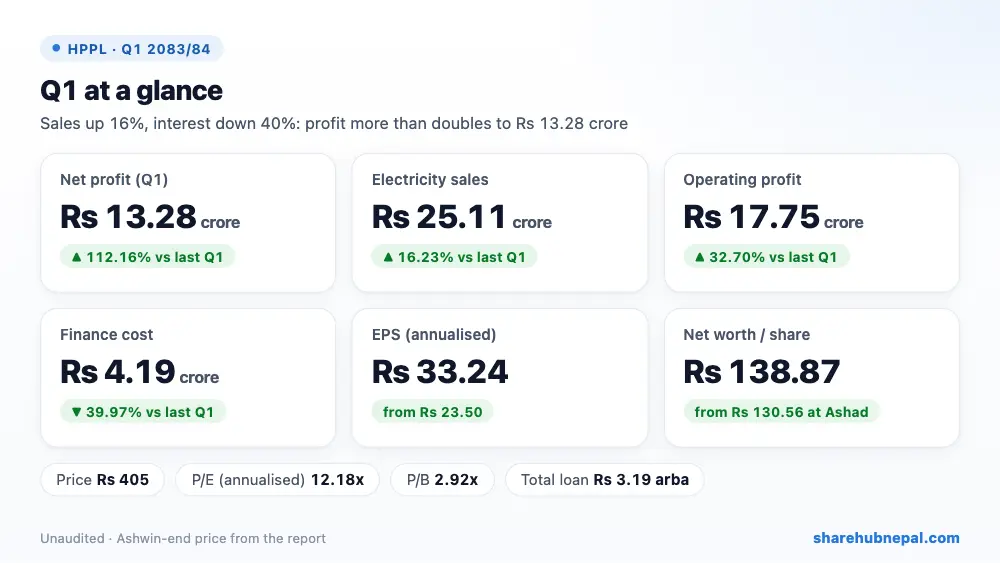
Summary
Himalayan Power Partner more than doubled its net profit to Rs 13.28 crore in the first quarter of FY 2083/84, from Rs 6.26 crore a year ago (+112.16%). Electricity sales from its Dordi Khola plant rose 16.23% to Rs 25.11 crore, cost of sales fell 35.92%, and finance cost dropped 39.97% to Rs 4.19 crore because the term loan was cut sharply after last year's right share issue. Quarter EPS is Rs 8.31 (Rs 33.24 annualised) and net worth per share rose to Rs 138.87.
| Indicator | Q1 2083/84 | Q1 2082/83 | Change |
| Revenue from sales | Rs 251,108,935 | Rs 216,050,050 | +16.23% |
| Cost of sales | Rs 10,510,974 | Rs 16,403,517 | −35.92% |
| Other income | Rs 0 | Rs 0 | – |
| Operating profit | Rs 177,452,455 | Rs 133,725,408 | +32.70% |
| Finance cost | Rs 41,932,223 | Rs 69,847,684 | −39.97% |
| Income tax | Rs 0 | Rs 0 | – |
| Net profit | Rs 132,809,828 | Rs 62,600,169 | +112.16% |
| EPS (annualised) | 33.24 | 23.5 | – |
| Net worth per share | 138.87 | 122.18 | – |
1. Where the profit came from
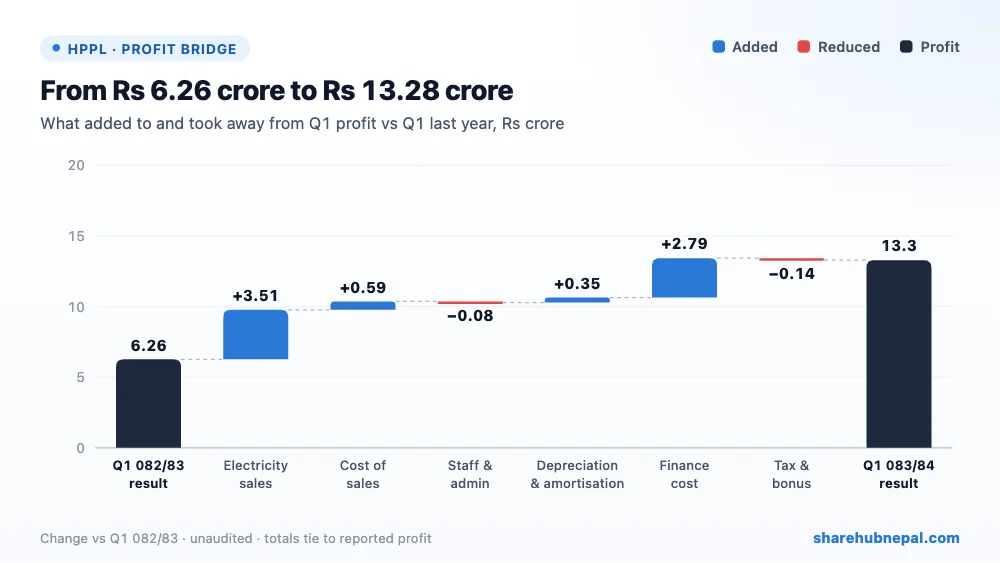
Sales of Rs 25.11 crore less cost of sales of Rs 1.05 crore gave a gross profit of Rs 24.06 crore (Rs 19.96 crore). Personnel and admin costs were Rs 38.39 lakh and depreciation and amortisation Rs 5.93 crore, so operating profit rose 32.70% to Rs 17.75 crore. Finance cost fell by Rs 2.79 crore to Rs 4.19 crore. After a staff bonus of Rs 27.10 lakh and no income tax, net profit was Rs 13.28 crore.
2. Profit through the year
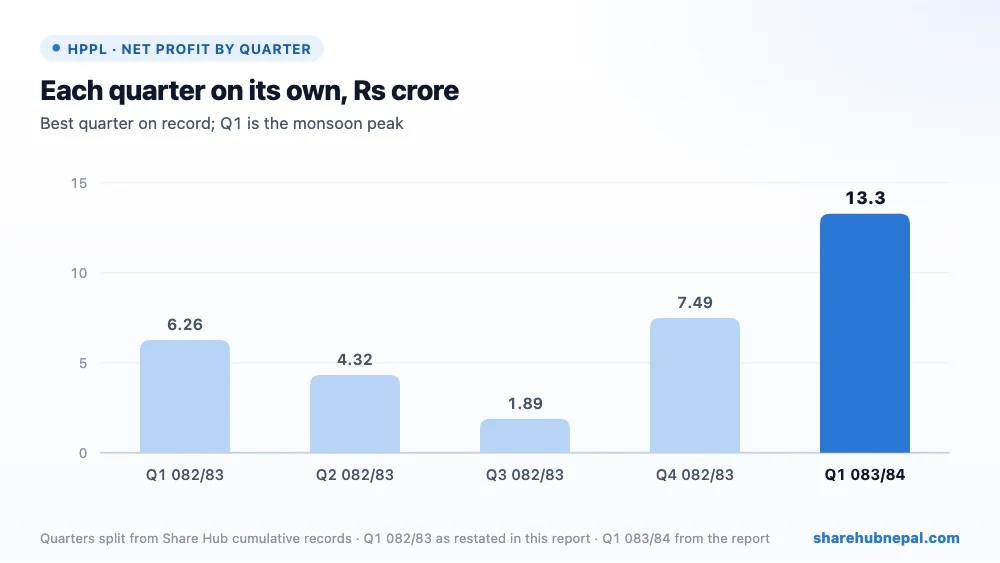
Profit by quarter (Share Hub cumulative records, split into quarters; Q1 082/83 as restated in this report): Q1 082/83: Rs 6.26 crore, Q2 082/83: Rs 4.32 crore, Q3 082/83: Rs 1.89 crore, Q4 082/83: Rs 7.49 crore, Q1 083/84: Rs 13.28 crore. This is the best quarter so far. Last year profit dipped in Q3 (Rs 1.89 crore) and the full year gave EPS of Rs 12.57, so annualised EPS of Rs 33.24 is too high for a full year. The company says NEA still issues dispatch instructions that cut its output below full capacity.
3. Debt and balance sheet
| Particulars | Ashwin 2083 | Ashad 2083 | Change |
| Total assets | Rs 5,434,925,042 | Rs 5,460,023,525 | −0.46% |
| Total equity | Rs 2,219,279,659 | Rs 2,086,469,821 | +6.37% |
| Term loan | Rs 2,789,723,283 | Rs 2,922,116,009 | −4.53% |
| Short-term loans | Rs 402,587,501 | Rs 403,687,500 | −0.27% |
| Trade and other receivables | Rs 488,499,176 | Rs 441,221,466 | +10.72% |
| Cash and equivalents | Rs 1,297,658 | Rs 24,625,486 | −94.73% |
| Current assets | Rs 524,357,441 | Rs 490,149,761 | +6.98% |
| Current liabilities | Rs 420,922,100 | Rs 446,437,694 | −5.72% |
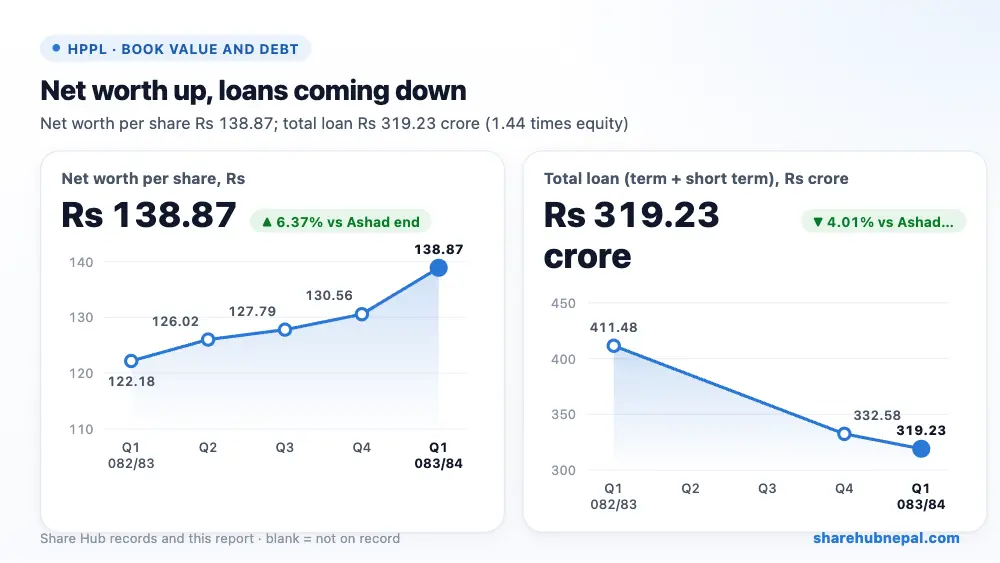
The term loan fell to Rs 2.79 arba from Rs 3.70 arba a year ago, and with short-term loans of Rs 40.26 crore total debt is Rs 3.19 arba, 1.44 times equity — still high but falling fast. The worry is cash: only Rs 12.98 lakh, while Rs 48.85 crore is due from customers (mainly NEA), up 10.72% since Ashad. The liquidity ratio is 1.25. Equity rose by the full Q1 profit to Rs 2.22 arba.
4. Per-share figures and valuation
| Indicator | Value |
| EPS (annualised) | Rs 33.24 |
| Net worth per share | Rs 138.87 |
| Market price (Ashwin end) | Rs 405 |
| P/E (annualised) | 12.18x |
| P/B | 2.92x |
At the Ashwin-end price of Rs 405, the share trades at 12.18 times annualised EPS and 2.92 times net worth per share. On last year's actual EPS of Rs 12.57 the P/E would be about 32 times; the report prints 48.73 using the quarter EPS.
Conclusion
Positives: profit more than doubled, sales up 16.23%, finance cost down 39.97%, debt falling, net worth per share up to Rs 138.87, and no legal cases.
Watch: cash is almost nil and receivables from NEA keep growing, NEA dispatch instructions still limit generation, profit is seasonal, and debt is still 1.44 times equity.
Watch whether NEA pays its dues faster, dry-season profit, and further loan repayment.
Figures are from the company's unaudited Q1 report; quarter trends use Share Hub records. This is not investment advice.

