













Nepal Warehousing Company Ltd. – First Quarter Analysis, FY 2083/84
Unaudited results as on Ashwin end 2083, compared with the same quarter last year (Ashwin end 2082) and with Ashad end 2083.
Summary
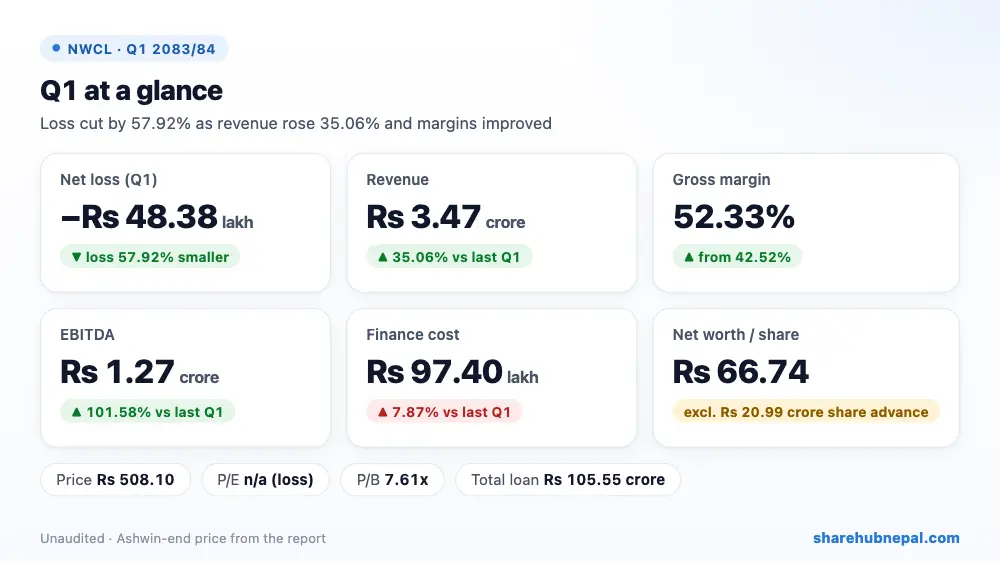
Nepal Warehousing lost Rs 48.38 lakh in the first quarter of FY 2083/84, much less than the Rs 1.15 crore loss a year ago (the loss is 57.92% smaller). Revenue from its grain storage services rose 35.06% to Rs 3.47 crore while direct operating costs rose only 12.02%, so the gross margin improved to 52.33% from 42.52% and EBITDA doubled to Rs 1.27 crore. Interest cost of Rs 97.40 lakh and depreciation of Rs 77.95 lakh still pushed the quarter into a loss. Net worth per share is Rs 66.74 as printed (it leaves out the Rs 20.99 crore paid as advance towards share capital).
| Indicator | Q1 2083/84 | Q1 2082/83 | Change |
| Revenue from operation | Rs 34,655,697 | Rs 25,659,456 | +35.06% |
| Direct operating expenses | Rs 16,521,437 | Rs 14,748,309 | +12.02% |
| Gross margin | Rs 18,134,260 | Rs 10,911,147 | +66.20% |
| Employee and other expenses | Rs 5,437,635 | Rs 4,612,583 | +17.89% |
| EBITDA | Rs 12,696,625 | Rs 6,298,564 | +101.58% |
| Finance cost | Rs 9,739,980 | Rs 9,029,709 | +7.87% |
| Depreciation and amortisation | Rs 7,794,560 | Rs 8,764,430 | −11.07% |
| Net loss | −Rs 4,837,915 | −Rs 11,495,575 | +57.91% |
| EPS (quarter, as printed) | -0.7 | -1.67 | – |
| Net worth per share | 66.74 | 103.17 | – |
1. Where the profit came from
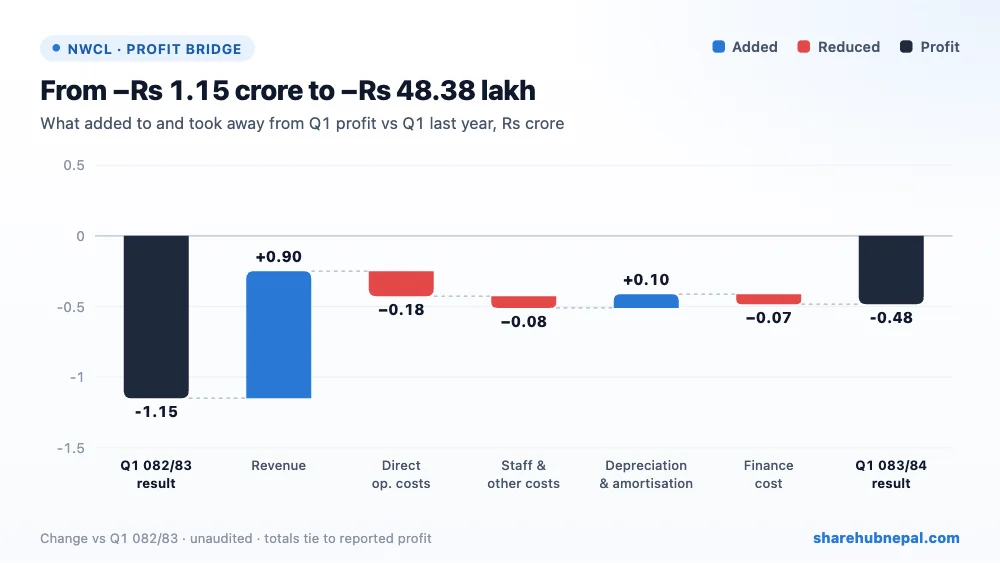
Higher revenue added Rs 89.96 lakh, against Rs 17.73 lakh more direct operating cost. Staff and other costs rose Rs 8.25 lakh and finance cost Rs 7.10 lakh, while depreciation fell Rs 9.70 lakh. Together the loss shrank by Rs 66.58 lakh.
2. Profit through the year
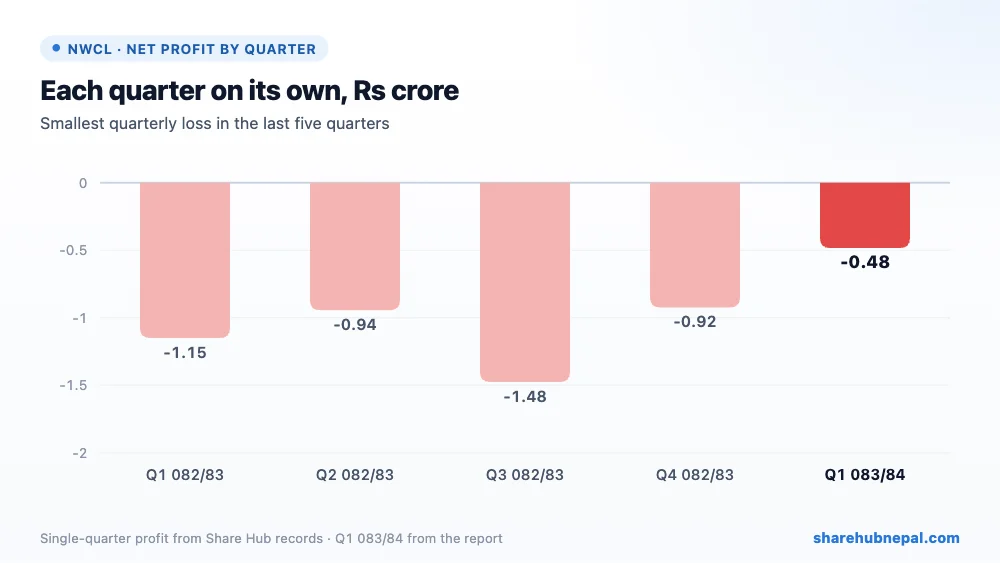
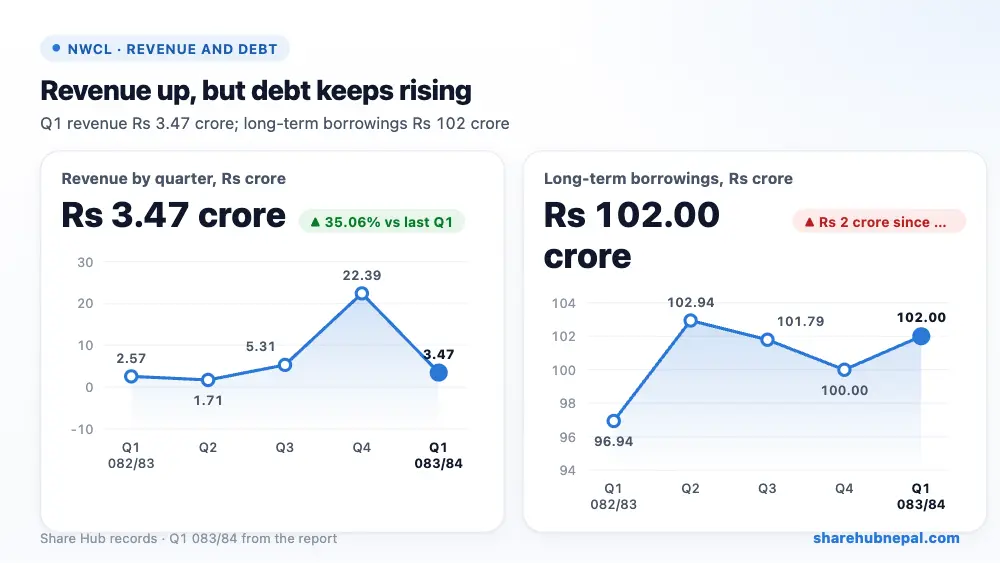
Profit by quarter (Share Hub records): Q1 082/83: −Rs 1.15 crore, Q2 082/83: −Rs 94.40 lakh, Q3 082/83: −Rs 1.48 crore, Q4 082/83: −Rs 92.40 lakh, Q1 083/84: −Rs 48.38 lakh. The company has made a loss in every quarter shown. Q4 brings most of the year's revenue (Rs 22.39 crore last year), so Q1 is a small quarter; FY 2082/83 ended with a loss and EPS of Rs -6.54 (Share Hub record).
3. Debt and balance sheet
| Particulars | Ashwin 2083 | Ashad 2083 | Change |
| Total assets | Rs 1,789,464,998 | Rs 1,800,337,620 | −0.60% |
| Total equity | Rs 668,700,741 | Rs 673,538,657 | −0.72% |
| Long-term borrowings | Rs 1,020,000,000 | Rs 1,000,000,000 | +2.00% |
| Current borrowings | Rs 35,500,000 | Rs 35,500,000 | +0.00% |
| Cash and equivalents | Rs 3,668,468 | Rs 9,170,625 | −60.00% |
| Capital work in progress | Rs 485,520,435 | Rs 476,644,913 | +1.86% |
| Advance towards share capital | Rs 209,890,000 | Rs 209,890,000 | +0.00% |
| Trade receivables | Rs 38,512,389 | Rs 48,966,997 | −21.35% |
Total assets are Rs 178.95 crore: warehouses and equipment Rs 104.62 crore and capital work in progress Rs 48.55 crore (the 15,000 tonne Kapilvastu unit, which management says is nearly complete). Long-term borrowings rose to Rs 102 crore, plus a Rs 3.55 crore loan from promoters. Equity is Rs 66.87 crore, which includes Rs 20.99 crore received as advance towards share capital; accumulated losses are Rs 22.87 crore. Cash is only Rs 36.68 lakh, but the current ratio is 1.76.
4. Per-share figures and valuation
| Indicator | Value |
| EPS (annualised) | Rs -2.80 |
| Net worth per share | Rs 66.74 |
| Market price (Ashwin end) | Rs 508.1 |
| P/E (annualised) | -181.46x |
| P/B | 7.61x |
At the Ashwin-end price of Rs 508.1, the share trades at -181.46 times annualised EPS and 7.61 times net worth per share. There are no earnings, and at Rs 508.10 the share trades at 7.61 times net worth per share, so the price is pricing in the Kapilvastu unit and future growth rather than current results.
Conclusion
Positives: revenue up 35.06%, gross margin up to 52.33%, EBITDA doubled, loss cut by more than half, Kapilvastu 15,000 tonne unit nearly complete, rising demand from warehouse receipt financing.
Watch: still loss-making, interest cost higher than operating profit, debt rising, accumulated losses Rs 22.87 crore, very low cash, net worth per share well below Rs 100, high P/B.
Operations are clearly improving, but the company needs the new Kapilvastu unit to add revenue faster than interest cost before it can turn a profit.
Figures are from the company's unaudited Q1 report; quarter trends use Share Hub records. This is not investment advice.

